Ausgelagerte Formeln: Unterschied zwischen den Versionen
| (19 dazwischenliegende Versionen von 2 Benutzern werden nicht angezeigt) | |||
| Zeile 3: | Zeile 3: | ||
== Cronbachs Alpha == | == Cronbachs Alpha == | ||
<pre> | <pre> | ||
\begin{equation} | |||
\alpha = \frac{p}{p-1}\times (1 -\frac{\sum\limits_{i=1}^p s^2_{Item}}{s^2_{Testwert}}) | |||
\end{equation} | |||
$p$ ... Anzahl der Items | |||
$s^2_{Item}$ ... Varianz der Items | |||
$s^2_{Testwert}$ ... Varianz der Rohwerte | |||
</pre> | </pre> | ||
| Zeile 259: | Zeile 266: | ||
</pre> | </pre> | ||
== Schätzung | == Schätzung My und Schätzung Sigma == | ||
<pre> | <pre> | ||
My: | |||
$$\mu=\frac{1}{n} \cdot \sum_{i=1}^{n} x_{i}$$ | $$\mu=\frac{1}{n} \cdot \sum_{i=1}^{n} x_{i}$$ | ||
Sigma: | |||
$$\sigma=\sqrt{\sum_{i=1}^{n}}\left(x_{i}-\mu\right)^{2}$$ | |||
</pre> | |||
== Dichtefunktion Ex-Gauß-Verteilung == | |||
<pre> | |||
$$\mu=\frac{\lambda}{2} \cdot e^{\frac{\lambda}{2} \cdot\left(2 \mu+\lambda \sigma^{2}-2 x\right)} \cdot e r f c\left(\frac{\mu+\lambda \sigma^{2}-x}{\sqrt{2} \sigma}\right)$$ | |||
</pre> | |||
== Komplementäre Fehlerfunktion Ex-Gauß == | |||
<pre> | |||
$$e r f c(x)=\frac{2}{\sqrt{\pi}} \int_{x}^{\infty} e^{-t^{2}} d t$$ | |||
</pre> | |||
== Dichtefunktion Gammaverteilung == | |||
<pre> | |||
$$f(x)=\left\{\begin{array}{ll} | |||
\frac{b^{p}}{\Gamma(p)} x^{p-1} e^{-b x} & x>0 \\ | |||
0 & x \leq 0 | |||
\end{array}\right.$$ | |||
</pre> | |||
== Gammafunktion == | |||
<pre> | |||
$$\Gamma(x)=\lim _{n \rightarrow \infty} \frac{n ! n^{x}}{x(x+1)(x+2) \ldots(x+n)}$$ | |||
</pre> | |||
== Gammaverteilung: Erwartungswert, Varianz, Schiefe == | |||
<pre> | |||
$$ | |||
\begin{array}{lll} | |||
\text { Erwartungswert } & = & \frac{p}{b} \\ | |||
\text { Varianz } & = & \frac{p}{b^{2}} \\ | |||
\text { Schiefe } & = & \frac{2}{\sqrt{p}} | |||
\end{array} | |||
$$ | |||
</pre> | |||
== Dichtefunktion Shifted-Wald Verteilung == | |||
<pre> | |||
\begin{equation} | |||
f(x) = \frac{\gamma}{2 \pi (x-\theta)}\cdot e^\frac{-(\gamma-\delta x + \delta\theta)^2}{2(x-\theta)} | |||
\end{equation} | |||
</pre> | |||
== Shifted-Wald Verteilung: Erwartungswert, Varianz == | |||
<pre> | |||
$$ | |||
\begin{array}{lll} | |||
\text { Erwartungswert } & = & \Theta+\frac{\gamma}{\delta} \\ | |||
\text { Varianz } & = & \frac{\gamma}{\delta^{3}} | |||
\end{array} | |||
$$ | |||
</pre> | |||
== Dichtefunktion Weibullverteilung == | |||
<pre> | |||
$$f(x)=\lambda k \cdot(\lambda x)^{k-1} \cdot e^{-(\lambda x)^{k}}$$ | |||
</pre> | </pre> | ||
| Zeile 433: | Zeile 500: | ||
<pre> | <pre> | ||
$$\mathrm{v}(\mathrm{x}, \mathrm{j})=\eta(\mathrm{x}, \mathrm{j}) \cdot \beta_{j} \cdot \frac{w_{x}}{\sum_{\mathrm{z \in S}} w_{x}}$$ | $$\mathrm{v}(\mathrm{x}, \mathrm{j})=\eta(\mathrm{x}, \mathrm{j}) \cdot \beta_{j} \cdot \frac{w_{x}}{\sum_{\mathrm{z \in S}} w_{x}}$$ | ||
</pre> | |||
== Differentialgleichungsmodelle 1 == | |||
<pre> | |||
$$t_0: p=10$$ | |||
$$t_1: p=20$$ | |||
$$t_2: p=40$$ | |||
$$t_3: p=80$$ | |||
</pre> | |||
== Differentialgleichungsmodelle 2 == | |||
<pre> | |||
$$p(t)=10 * 2^{t}$$ | |||
</pre> | |||
== Differentialgleichungsmodelle 3 == | |||
<pre> | |||
$$p(t+1)=p(t)+p(t) * 1$$ | |||
</pre> | |||
== Differentialgleichungsmodelle 4 == | |||
<pre> | |||
$$p(t+1)=p(t)+\alpha * p(t)$$ | |||
</pre> | |||
== Differentialgleichungsmodelle 5 == | |||
<pre> | |||
$$p(t+\Delta t)=p(t)+\alpha * \Delta t * p(t)$$ | |||
</pre> | |||
== Differentialgleichungsmodelle 6 == | |||
<pre> | |||
$$\frac{p(t+\Delta t)-p(t)}{\Delta t}=\alpha * p(t)$$ | |||
</pre> | |||
== Differentialgleichungsmodelle 7 == | |||
<pre> | |||
$$\lim _{\Delta t \rightarrow 0} \frac{p(t+\Delta t)-p(t)}{\Delta t}=\alpha * p(t)$$ | |||
</pre> | |||
== Differentialgleichungsmodelle 8 == | |||
<pre> | |||
$$\dot{p}(t)=\alpha * p(t)$$ | |||
</pre> | |||
== Differentialgleichungsmodelle 9 == | |||
<pre> | |||
$$\dot{p}(t)=\frac{d p}{d t}=\alpha * p(t)$$ | |||
</pre> | |||
== Differentialgleichungsmodelle 10 == | |||
<pre> | |||
$$\text { Hase }=\text { Geburtenrate } * \text { Hase }-\text { Verlustrate } * \text { Fuchs } * \text { Hase }$$ | |||
</pre> | |||
== Differentialgleichungsmodelle 11 == | |||
<pre> | |||
$$\text { Fuchs }=\text { Erfolgsrate } * \text { Hase } * \text { Fuchs }-\text { Sterberate } * \text { Fuchs }$$ | |||
</pre> | </pre> | ||
| Zeile 445: | Zeile 570: | ||
===Frage von Josephine=== | ===Frage von Josephine=== | ||
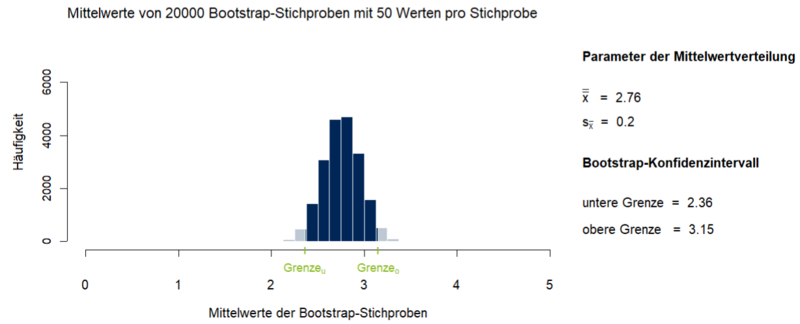
* Wie beschreibt man Balkendiagramme? | |||
** Bsp.: [[File:1_7_Bootstrapping.PNG|800px|Abbildung 1: Mittelwerte von 20000 Bootstrap-Stichproben (n=50) mit Darstellung des 95%-Konfidenzintervalls]] | |||
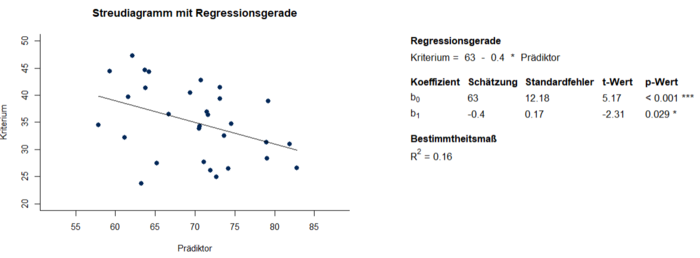
* Wie beschreibt man Streudiagramme? | |||
** Bsp.: [[File:3_1_ELR_1.PNG|700px|Abbildung 1: Streudiagramm und Parameter der einfachen linearen Regression aus Alter und Gedächtnisleistung]] | |||
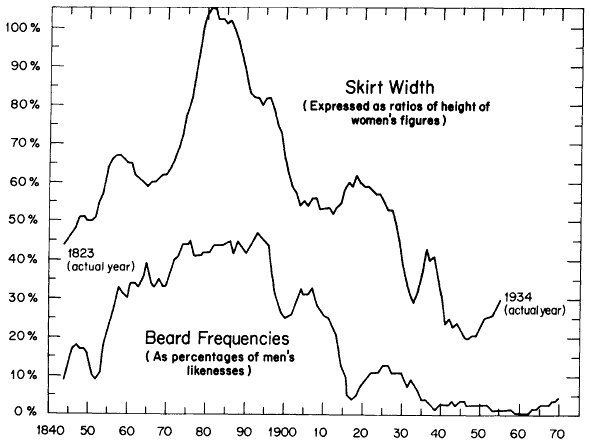
* Wie beschreibt man solche Verläufe? | |||
** Bsp.: [[File:BeispielInhaltsanalyseRobinson1976.png]] | |||
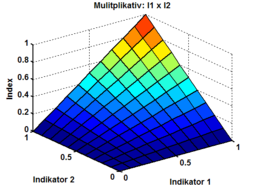
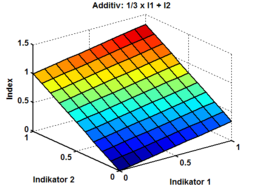
* Wie beschreibt man solche Darstellungen? | |||
** Bsp. 1: [[File:multiplikativeindexbildung.png|256px]] | |||
** Bsp. 2: [[File:gewichteteadditiveindexbildung.png|256px]] | |||
Aktuelle Version vom 14. Februar 2022, 14:53 Uhr
Hier werden alle zu langen Formeln als LaTeX-Code hinterlegt.
Cronbachs Alpha
\begin{equation}
\alpha = \frac{p}{p-1}\times (1 -\frac{\sum\limits_{i=1}^p s^2_{Item}}{s^2_{Testwert}})
\end{equation}

$p$ ... Anzahl der Items
$s^2_{Item}$ ... Varianz der Items
$s^2_{Testwert}$ ... Varianz der Rohwerte
Inzidenz
$$\mathrm{Inzidenz}=\frac{\mathrm{\text{Anzahl neuer Fälle (Zeit t)}}}
{\mathrm{Grundgesamtheit}}$$
Standardfehler
$$\sigma_{\overline{\mathrm{x}}}=\frac{\sigma}{\sqrt{\mathrm{n}}}$$
t-Wert
$$\mathrm{t}=\frac{\overline{\mathrm{x}}-\mu}{\mathrm{s}} \sqrt{\mathrm{n}}$$
F-Wert
$$\mathrm{F}=\frac{\mathrm{QS}_{\mathrm{zwischen}}}{\mathrm{df}_{\mathrm{zwischen}}}:
\frac{\mathrm{QS}_{\text {innerhalb }}}{\mathrm{df}_{\text {innerhalb }}}$$
Grenzen eines Konfidenzintervalls
$$G_{u}=\bar{X}-z_{1-\frac{\alpha}{2}} \cdot \sigma_{\bar{x}}$$
$$G_{o}=\bar{X}+z_{1-\frac{\alpha}{2}} \cdot \sigma_{\bar{x}}$$
Stichprobenumfang
$$\mathrm{n}=\frac{\left(\mathrm{z}_{1-\beta} + \mathrm{z}_{1-\alpha}\right)^{2} \cdot \sigma^{2}}{\Delta^{2}}$$
Pearsons Produkt-Moment-Korrelationskoeffizient r
$$\mathrm{r}_{\mathrm{xy}}=\frac{\sum_{\mathrm{i}=1}^{\mathrm{n}}\left(\mathrm{x}_{\mathrm{i}}-\overline{\mathrm{x}}\right) \cdot\left(\mathrm{y}_{\mathrm{i}}-\overline{\mathrm{y}}\right)}{(\mathrm{n}-1) \cdot \mathrm{s}_{\mathrm{x}} \cdot \mathrm{s}_{\mathrm{y}}}$$
Spearmans Rangkorrelationskoeffizient
$$\rho_{\mathrm{xy}}=\frac{\sum_{\mathrm{i}=1}^{\mathrm{n}}\left(\mathrm{r}_{\mathrm{x}_{\mathrm{i}}}-\overline{\mathrm{r}}_{\mathrm{x}}\right) \cdot\left(\mathrm{r}_{\mathrm{y}_{\mathrm{i}}}-\overline{\mathrm{r}}_{\mathrm{y}}\right)}{(\mathrm{n}-1) \cdot \mathrm{s}_{\mathrm{r}_{\mathrm{x}}} \cdot \mathrm{s}_{\mathrm{r}_{\mathrm{y}}}}$$
Kendalls Tau
$$\tau=\frac{2 S}{n(n-1)}$$
Partieller Korrelationskoeffizient
$$r_{x y, z}=\frac{r_{x y}-r_{x z} \cdot r_{y z}}{\sqrt{\left(1-r_{x z}^{2}\right) \cdot\left(1-r_{y z}^{2}\right)}}$$
Einfache lineare Regression
$$y_{i}=b_{0}+b_{1} \cdot x_{i}+e_{i}$$
Anzahl k (Trimmed Squares Methode)
$$\mathrm{k}=\frac{\mathrm{n}+\mathrm{p}+1}{2}$$
Regressionskoeffizient
$$\widehat{\mathrm{b}}_{1}=\frac{\mathrm{s}_{\mathrm{xy}}}{\mathrm{s}_{\mathrm{x}}^{2}}$$
Regressionskonstante
$$\widehat{\mathrm{b}}_{0}=\overline{\mathrm{y}}-\widehat{\mathrm{b}}_{1} \cdot \overline{\mathrm{x}}$$
Summe der Residuen
$$\sum_{i=1}^{n} e_{i}=0$$
Bestimmtheitsmaß R²
$$\mathrm{R}^{2}=\frac{\mathrm{QS}(\widehat{\mathrm{y}})}{\mathrm{QS}(\mathrm{y})}
=\frac{\sum_{\mathrm{i}=1}^{\mathrm{n}}\left(\widehat{\mathrm{y}}_{\mathrm{i}}-\overline{\mathrm{y}}\right)^{2}}{\sum_{\mathrm{i}=1}^{\mathrm{n}}\left(\mathrm{y}_{\mathrm{i}}-\overline{\mathrm{y}}\right)^{2}}$$
Multiple lineare Regression
$$y_{i}=b_{0}+b_{1} \cdot x_{1 i}+b_{2} \cdot x_{2 i}+\ldots+b_{k} \cdot x_{k i}+e_{i}$$
Regressionsgleichung im Beispiel Multiple lineare Regression
$$y_{i}=3.93-0.38 \cdot x_{1}+0.77 \cdot x_{2}+0.13 \cdot x_{3}+0.16 \cdot x_{4}$$
Varianzinflationsfaktor
$$\mathrm{VIF}_{\mathrm{j}}=\frac{1}{\mathrm{Tol}_{\mathrm{j}}}$$
Moderierte Regression
$$y_{i}=b_{0}+b_{1} \cdot x_{1 i}+b_{2} \cdot x_{2 i}+b_{3} \cdot x_{1 i} \cdot x_{2 i}+e_{i}$$
Hauptkomponentenanalyse
$$\mathrm{z}_{\mathrm{ik}}=\mathrm{a}_{\mathrm{i} 1} \cdot \mathrm{f}_{1 \mathrm{k}}+\mathrm{a}_{\mathrm{i} 2} \cdot
\mathrm{f}_{2 \mathrm{k}}+\cdots+\mathrm{a}_{\mathrm{im}} \cdot \mathrm{f}_{\mathrm{mk}}$$
Exponentielles Discounting
$$D U(x, t)=U(x) \cdot \delta^{t}$$
Hyperbolisches Discounting
$$D U(x, t)=\frac{U(x)}{1+k t}$$
Hyperboloid Modell
$$D U(x, t)=\frac{U(x)}{(1+kt)^{2}}$$
Quasi-hyperbolisches Discounting t = 0
$$D U(x, t)=U(x)$$
Quasi-hyperbolisches Discounting t > 0
$$D U(x, t)=U(x) \cdot \beta \delta^{t}$$
SSE
$$S S E=\sum\left(Y_{d}-Y_{m}\right)^{2}$$
Likelihood L
$$L=P(\text { Daten } \mid \text { Modellparameter })=\prod_{i} P\left(d_{i} \mid p, b\right)$$
Log-Likelihood
$$\log (L)=\log (P(\text { Daten } \mid \text { Modellparameter }))=\sum_{i} \log \left(P\left(d_{i} \mid p, b\right)\right)$$
Lernregel (Hebb'sches Lernen)
$$\Delta w_{x y}=\lambda \cdot x \cdot y$$
Deltaregel
$$\Delta w_{x y}=\alpha \cdot\left(y_{k o r r e k t}-y_{b e o b a c h t e t}\right) \cdot x$$
Deltaregel (verkürzt)
$$\Delta w_{x y}=\alpha \cdot \Delta y \cdot x$$
Gesamtfehler
$$E_{G e s a m t}=\sum E_{i}=\sum \text { Output }_{i}-\text { Vorgabe }_{i}$$
Ableitung des Gesamtfehlers nach Gewicht w46
$$\frac{d E_{\text {Gesamt }}}{d w_{46}}=\delta_{6} \cdot O u t p u t_{6}$$
Veränderung des Gewichts w46
$$w_{46}=w_{46}-\eta \cdot \frac{d E_{G e s a m t}}{d w_{46}}$$
Aktivierung der Knoten
$$\tau \dot{u}(x, t)=-u(x, t)+h+\int f\left(u\left(x^{\prime}, t\right)\right) \cdot \omega\left(x-x^{\prime}\right) d x^{\prime}+S(x, t)$$
- x – ein Knoten
- x' – ein Nachbarknoten
- u(x,t) – Aktivierung u eines Knotens x zum Zeitpunkt t
- τ – Zeitkonstante
- h – Ruhepotential
- f – (meist) sigmoidale Aktivierungsfunktion
- ω – Interaktionskernel (Mexican-Hat-Funktion)
- S(x,t) – externer stimulusbedingter Input für jeden Knoten x zu jedem Zeitpunkt t
General Linear Model 1
$$\boldsymbol{Y}=\boldsymbol{X} \cdot \boldsymbol{b}+\boldsymbol{e}$$
$Y$ ... Vektor der Kriteriumsvariablen
$X$ ... Matrix der Prädiktoren (= Designmatrix)
$b$ ... Vektor der Gewichte aller Prädiktoren
$e$ ... Vektor der Residuen
General Linear Model 2
$$\sum_{i=1}^{n} e_{i}^{2}=\sum_{i=1}^{n}\left[Y_{i}-(X b)_{i}\right]^{2} \rightarrow Minimum$$
$n$ ... Anzahl an Individuen
General Linear Model 3
$$\hat{b}=\left(X^{T} \cdot X\right)^{-1} \cdot X^{T} \cdot Y$$
$\hat{b}$ ... Schätzung von b
$(X^{T} \cdot X)^{-1}$ ... inverse Matrix von $X^{T} X$
$X^{T}$ ... Transposition der Matrix X
t-Test als Spezialfall des GLM
$$y=b_{o}+x \cdot b_{1}$$
mit
$b_0$ = Konstante
$x$ = Wert der Prädiktorvariable
$b_1$ = Steigung der Prädiktorvariable pro Einheit
Prüfgröße t
$$t=\frac{x_1-x_2}{s}$$
mit
$x_1$ = Mittelwert Gruppe 1
$x_2$ = Mittelwert Gruppe 2
$s$ = gepoolte Standardabweichung
General Linear Model 4
$$b=x_1+g \cdot \Delta$$
mit g = 0 für Mittelwert der Gruppe 1 und g = 1 für Mittelwert der Gruppe 2
Dichtefunktion Normalverteilung
$$f(x)=\frac{1}{\sigma \cdot \sqrt{2 \pi}} \cdot e^{-\frac{1}{2} \cdot\left(\frac{x-\mu}{\sigma}\right)^{2}}$$
Schätzung My und Schätzung Sigma
My:
$$\mu=\frac{1}{n} \cdot \sum_{i=1}^{n} x_{i}$$

Sigma:
$$\sigma=\sqrt{\sum_{i=1}^{n}}\left(x_{i}-\mu\right)^{2}$$
Dichtefunktion Ex-Gauß-Verteilung
$$\mu=\frac{\lambda}{2} \cdot e^{\frac{\lambda}{2} \cdot\left(2 \mu+\lambda \sigma^{2}-2 x\right)} \cdot e r f c\left(\frac{\mu+\lambda \sigma^{2}-x}{\sqrt{2} \sigma}\right)$$
Komplementäre Fehlerfunktion Ex-Gauß
$$e r f c(x)=\frac{2}{\sqrt{\pi}} \int_{x}^{\infty} e^{-t^{2}} d t$$
Dichtefunktion Gammaverteilung
$$f(x)=\left\{\begin{array}{ll}
\frac{b^{p}}{\Gamma(p)} x^{p-1} e^{-b x} & x>0 \\
0 & x \leq 0
\end{array}\right.$$
Gammafunktion
$$\Gamma(x)=\lim _{n \rightarrow \infty} \frac{n ! n^{x}}{x(x+1)(x+2) \ldots(x+n)}$$
Gammaverteilung: Erwartungswert, Varianz, Schiefe
$$
\begin{array}{lll}
\text { Erwartungswert } & = & \frac{p}{b} \\
\text { Varianz } & = & \frac{p}{b^{2}} \\
\text { Schiefe } & = & \frac{2}{\sqrt{p}}
\end{array}
$$
Dichtefunktion Shifted-Wald Verteilung
\begin{equation}
f(x) = \frac{\gamma}{2 \pi (x-\theta)}\cdot e^\frac{-(\gamma-\delta x + \delta\theta)^2}{2(x-\theta)}
\end{equation}
Shifted-Wald Verteilung: Erwartungswert, Varianz
$$
\begin{array}{lll}
\text { Erwartungswert } & = & \Theta+\frac{\gamma}{\delta} \\
\text { Varianz } & = & \frac{\gamma}{\delta^{3}}
\end{array}
$$
Dichtefunktion Weibullverteilung
$$f(x)=\lambda k \cdot(\lambda x)^{k-1} \cdot e^{-(\lambda x)^{k}}$$
Objective Functions Beispiel
$$Y=D U(x, t)=U(x) \cdot \delta^{t}$$
Fehlerquadratsumme SSE
$$S S E(\delta)=\sum\left(Y_{d}-Y_{m}(\delta)\right)^{2}$$
$Y_d$ ... empirische Werte
$Y_m(\delta)$ ... Y-Werte des Modells mit entsprechendem Parameter delta
Verbundswahrscheinlichkeit
$$P\left(X=x_{i}, Y=y_{i}\right)=p\left(x_{i}, y_{i}\right)=\frac{n_{i j}}{N}$$
Randwahrscheinlichkeit
$$P\left(X=x_{i}\right)=\frac{c_{i}}{N}$$
Bedingte Wahrscheinlichkeit
$$P\left(X=x_{i}, Y=y_{i}\right)=\frac{n_{i j}}{c_{i}}$$
Produktregel
$$P\left(X=x_{i}, Y=y_{i}\right)=\frac{n_{i_{j}}}{N}=\frac{n_{i_{j}}}{c_{i}} * \frac{c_{i}}{N}=P\left(X=x_{i}, Y=y_{i}\right) * P\left(X=x_{i}\right)$$
Satz von Bayes
$$p(y \mid x)=\frac{p(x \mid y) p(y)}{p(x)}$$
Regressionsmodell
$$y=\beta_{0}+\beta_{1} * x$$
Satz von Bayes mit Parameter β
$$p(\boldsymbol{\beta} \mid D)=\frac{p(D \mid \boldsymbol{\beta}) p(\boldsymbol{\beta})}{p(D)}$$

blau dargestellt: $p(\boldsymbol{\beta} \mid D)$
grün dargestellt: $p(D \mid \boldsymbol{\beta}$
gelb dargestellt: $p(\boldsymbol{\beta}$
Hierarchical Gaussian Filtering (1)
$$x^{(k)} \sim N\left(x^{(k-1)}, \vartheta\right), \quad k=1,2, \ldots$$
Hierarchical Gaussian Filtering (2)
$$x_{1}^{(k)} \sim N\left(x_{1}^{(k-1)}, f\left(x_{2}\right)\right)$$
Hierarchical Gaussian Filtering (3)
$$x_{2}^{(k)} \sim N\left(x_{2}^{(k-1)}, f_{2}\left(x_{3}\right)\right)$$
Hierarchical Gaussian Filtering (4)
$$x_{i}^{(k)} \sim N\left(x_{i}^{(k-1)}, f_{i}\left(x_{i+1}\right)\right), \quad i=1, \ldots, n-1$$
Hierarchical Gaussian Filtering (5)
$$x_{n}^{(k)} \sim N\left(x_{n}^{k-1)}, \vartheta\right), \quad \vartheta>0$$
AIC
$$A I C_{m}=-2 \cdot \ln \left(L_{m}\right)+2 \cdot\left|k_{m}\right|$$
$L_m$ ... Likelihood des Modells
$k_m$ ... Anzahl der Parameter
BIC
$$B I C_{m}=-2 \cdot \ln \left(L_{m}\right)+\ln (n) \cdot\left|k_{m}\right|$$
$L_m$ ... Likelihood des Modells
$k_m$ ... Anzahl der Parameter
$n$ ... Anzahl der Beobachtungen
Beispiel einfache lineare Regression
$$y_{i}=b_{0}+b_{1} \cdot x_{i}+e_{i} \quad(i=1, \ldots, n)$$
$y_i$ : Wert der Kriteriumsvariablen Y des i-ten Probanden
$x_i$ : Wert der Prädiktorvariabalen X des i-ten Probanden
$e_i$ : Residuum des i-ten Probanden
$b_0, b_1$ : Regressionskoeffizienten
$n$ : Anzahl der Probanden
Mittelwert μ
$$\mu=\frac{1}{n} \cdot \sum_{i=1}^{n} x_{i}$$
Standardabweichung σ
$$\sigma=\sqrt{\sum_{i=1}^{n}\left(x_{i}-\mu\right)^{2}}$$
Berechnung Modellparameter b1
$$b_{1}=\frac{S S_{X Y}}{S S_{X X}}=\frac{n \cdot \sum_{i=1}^{n} x_{i} \cdot y_{i}-\sum_{i=1}^{n} x_{i} \cdot \sum_{i=1}^{n} y_{i}}{n \cdot \sum_{i=1}^{n} x_{i}{ }^{2}-\left(\sum_{i=1}^{n} x_{i}\right)^{2}}$$
Berechnung Modellparameter b0
$$b_{0}=\bar{y}-b_{1} \cdot \bar{x}=\frac{\sum_{i=1}^{n} x_{i}{ }^{2} \cdot \sum_{i=1}^{n} y_{i}-\sum_{i=1}^{n} x_{i} \cdot \sum_{i=1}^{n} x_{i} y_{i}}{n \cdot \sum_{i=1}^{n} x_{i}{ }^{2}-\left(\sum_{i=1}^{n} x_{i}\right)^{2}}$$
Sequential Sampling
$$x(t)=x(t-1)+A+n$$
$x(t)$ … Entscheidungszustand zum Zeitpunkt t
$A$ … Evidenz (positiv / negativ)
$n$ … Noise (Rauschen / Fehler)
Modell von Tuller 1
$$V(P h i)=k * P h i-s\left(\frac{P h i^{2}}{2}-\frac{P h i^{4}}{4}\right)$$
Modell von Tuller 2
$$V^{\prime}(P h i)=k-s\left(P h i-P h i^{3}\right)$$
Modell von Tuller 3
$$P h i(t)=P h i(t-1)+k-s\left(P h i-P h i^{3}\right)$$
Rescorla-Wagner Modell
$$V_{t}=V_{t-1}+\alpha\left(\lambda-V_{t-1}\right)$$
$V$ = Assoziationsstärke der Reize (CS+US)
$\alpha$ = Lernrate
$\lambda$ = Stärke des präsentierten US (z.B. $\lambda = 1$, wenn US; $\lambda = 0$, wenn kein US)
$t$ = Lerndurchgänge / Trial Nummer
TVA 1
$$w(x)=\sum_{j \in R} \eta(x, j) \cdot \pi_{j}$$
TVA 2
$$\mathrm{v}(\mathrm{x}, \mathrm{j})=\eta(\mathrm{x}, \mathrm{j}) \cdot \beta_{j} \cdot \frac{w_{x}}{\sum_{\mathrm{z \in S}} w_{x}}$$
Differentialgleichungsmodelle 1
$$t_0: p=10$$
$$t_1: p=20$$
$$t_2: p=40$$
$$t_3: p=80$$
Differentialgleichungsmodelle 2
$$p(t)=10 * 2^{t}$$
Differentialgleichungsmodelle 3
$$p(t+1)=p(t)+p(t) * 1$$
Differentialgleichungsmodelle 4
$$p(t+1)=p(t)+\alpha * p(t)$$
Differentialgleichungsmodelle 5
$$p(t+\Delta t)=p(t)+\alpha * \Delta t * p(t)$$
Differentialgleichungsmodelle 6
$$\frac{p(t+\Delta t)-p(t)}{\Delta t}=\alpha * p(t)$$
Differentialgleichungsmodelle 7
$$\lim _{\Delta t \rightarrow 0} \frac{p(t+\Delta t)-p(t)}{\Delta t}=\alpha * p(t)$$
Differentialgleichungsmodelle 8
$$\dot{p}(t)=\alpha * p(t)$$
Differentialgleichungsmodelle 9
$$\dot{p}(t)=\frac{d p}{d t}=\alpha * p(t)$$
Differentialgleichungsmodelle 10
$$\text { Hase }=\text { Geburtenrate } * \text { Hase }-\text { Verlustrate } * \text { Fuchs } * \text { Hase }$$
Differentialgleichungsmodelle 11
$$\text { Fuchs }=\text { Erfolgsrate } * \text { Hase } * \text { Fuchs }-\text { Sterberate } * \text { Fuchs }$$
Bitte testen
Frage von Paul
geht tiefgestellter und hochgestellter Text. eine tiefgestellte Formel fx+1
eine hochgestellter Formel fx+1
